Your App Is Talking. Are You Listening?
Every application tells a story.
Not through its interface or its documentation, but through the thousands of events it produces every day.
A user signs in.
A payment succeeds.
A webhook fails.
A domain expires.
An SSL certificate is renewed.
A deployment completes.
An API starts responding more slowly than usual.
None of these events exist in isolation. Together, they reveal the health of your application long before your customers notice something is wrong.
The problem isn't that applications don't generate enough information.
It's that most teams are drowning in it.
The Difference Between Data and Awareness
Modern software produces an incredible amount of telemetry.
Logs stream endlessly. Metrics update every second. Monitoring dashboards fill with graphs. Alerts arrive at all hours of the day.
Yet despite all this visibility, many teams still discover problems the same way:
A customer sends an email.
A teammate notices something "looks off."
Revenue unexpectedly drops.
By then, the issue has often existed for hours—or days.
Collecting data isn't the same as understanding what's happening.
True observability begins when raw events become meaningful signals.
Every Event Tells You Something
An event is more than a timestamp.
It's evidence that something changed.
Sometimes that change is expected.
Sometimes it's the first sign that something is about to go wrong.
A single failed webhook may not matter.
A hundred failed webhooks in ten minutes almost certainly do.
One login failure is normal.
A sudden spike in authentication failures after a deployment deserves attention.
A scheduled backup completing successfully may seem routine—until one doesn't.
Context transforms ordinary events into valuable insight.
The goal isn't to watch everything.
The goal is to recognize what deserves your attention.
Most Incidents Start Small
Very few outages happen all at once.
More often, they begin quietly.
A background worker starts taking longer to process jobs.
A DNS record changes unexpectedly.
A payment provider begins returning intermittent errors.
An external API starts timing out once every few hundred requests.
Nothing appears urgent.
The application still works.
Customers continue using it.
Then those small issues compound.
The queue grows.
Retries increase.
Requests begin failing.
Support tickets arrive.
The incident has already begun—you just didn't know it yet.
The earlier you notice subtle changes, the easier they are to fix.
Infrastructure Is Only Half the Story
It's easy to monitor servers.
CPU usage.
Memory consumption.
Disk space.
Network traffic.
These metrics are important.
But healthy infrastructure doesn't always mean a healthy application.
Your servers can be running perfectly while customers can't complete purchases.
Email delivery can silently fail.
Webhook integrations can stop working.
SSL certificates can approach expiration.
Critical domains can become unreachable.
Business events often matter just as much as infrastructure metrics.
Sometimes, they matter even more.
Build Systems That Surface What Matters
The answer isn't more alerts.
It's better ones.
When every notification is marked as urgent, eventually none of them are.
Effective event monitoring prioritizes signal over noise.
Routine activity should remain visible without demanding attention.
Important changes should stand out immediately.
Critical incidents should never be buried beneath thousands of informational logs.
The best monitoring systems don't overwhelm you with information.
They quietly organize it so the important things become impossible to miss.
From Events to Situational Awareness
The strongest engineering teams don't spend their mornings searching through log files trying to understand what happened overnight.
They already know.
Not because they watched every event individually, but because their systems organized those events into meaningful situations.
Instead of isolated alerts, they see context.
Instead of disconnected logs, they see patterns.
Instead of reacting after customers report issues, they respond while problems are still small.
That's the difference between monitoring and situational awareness.
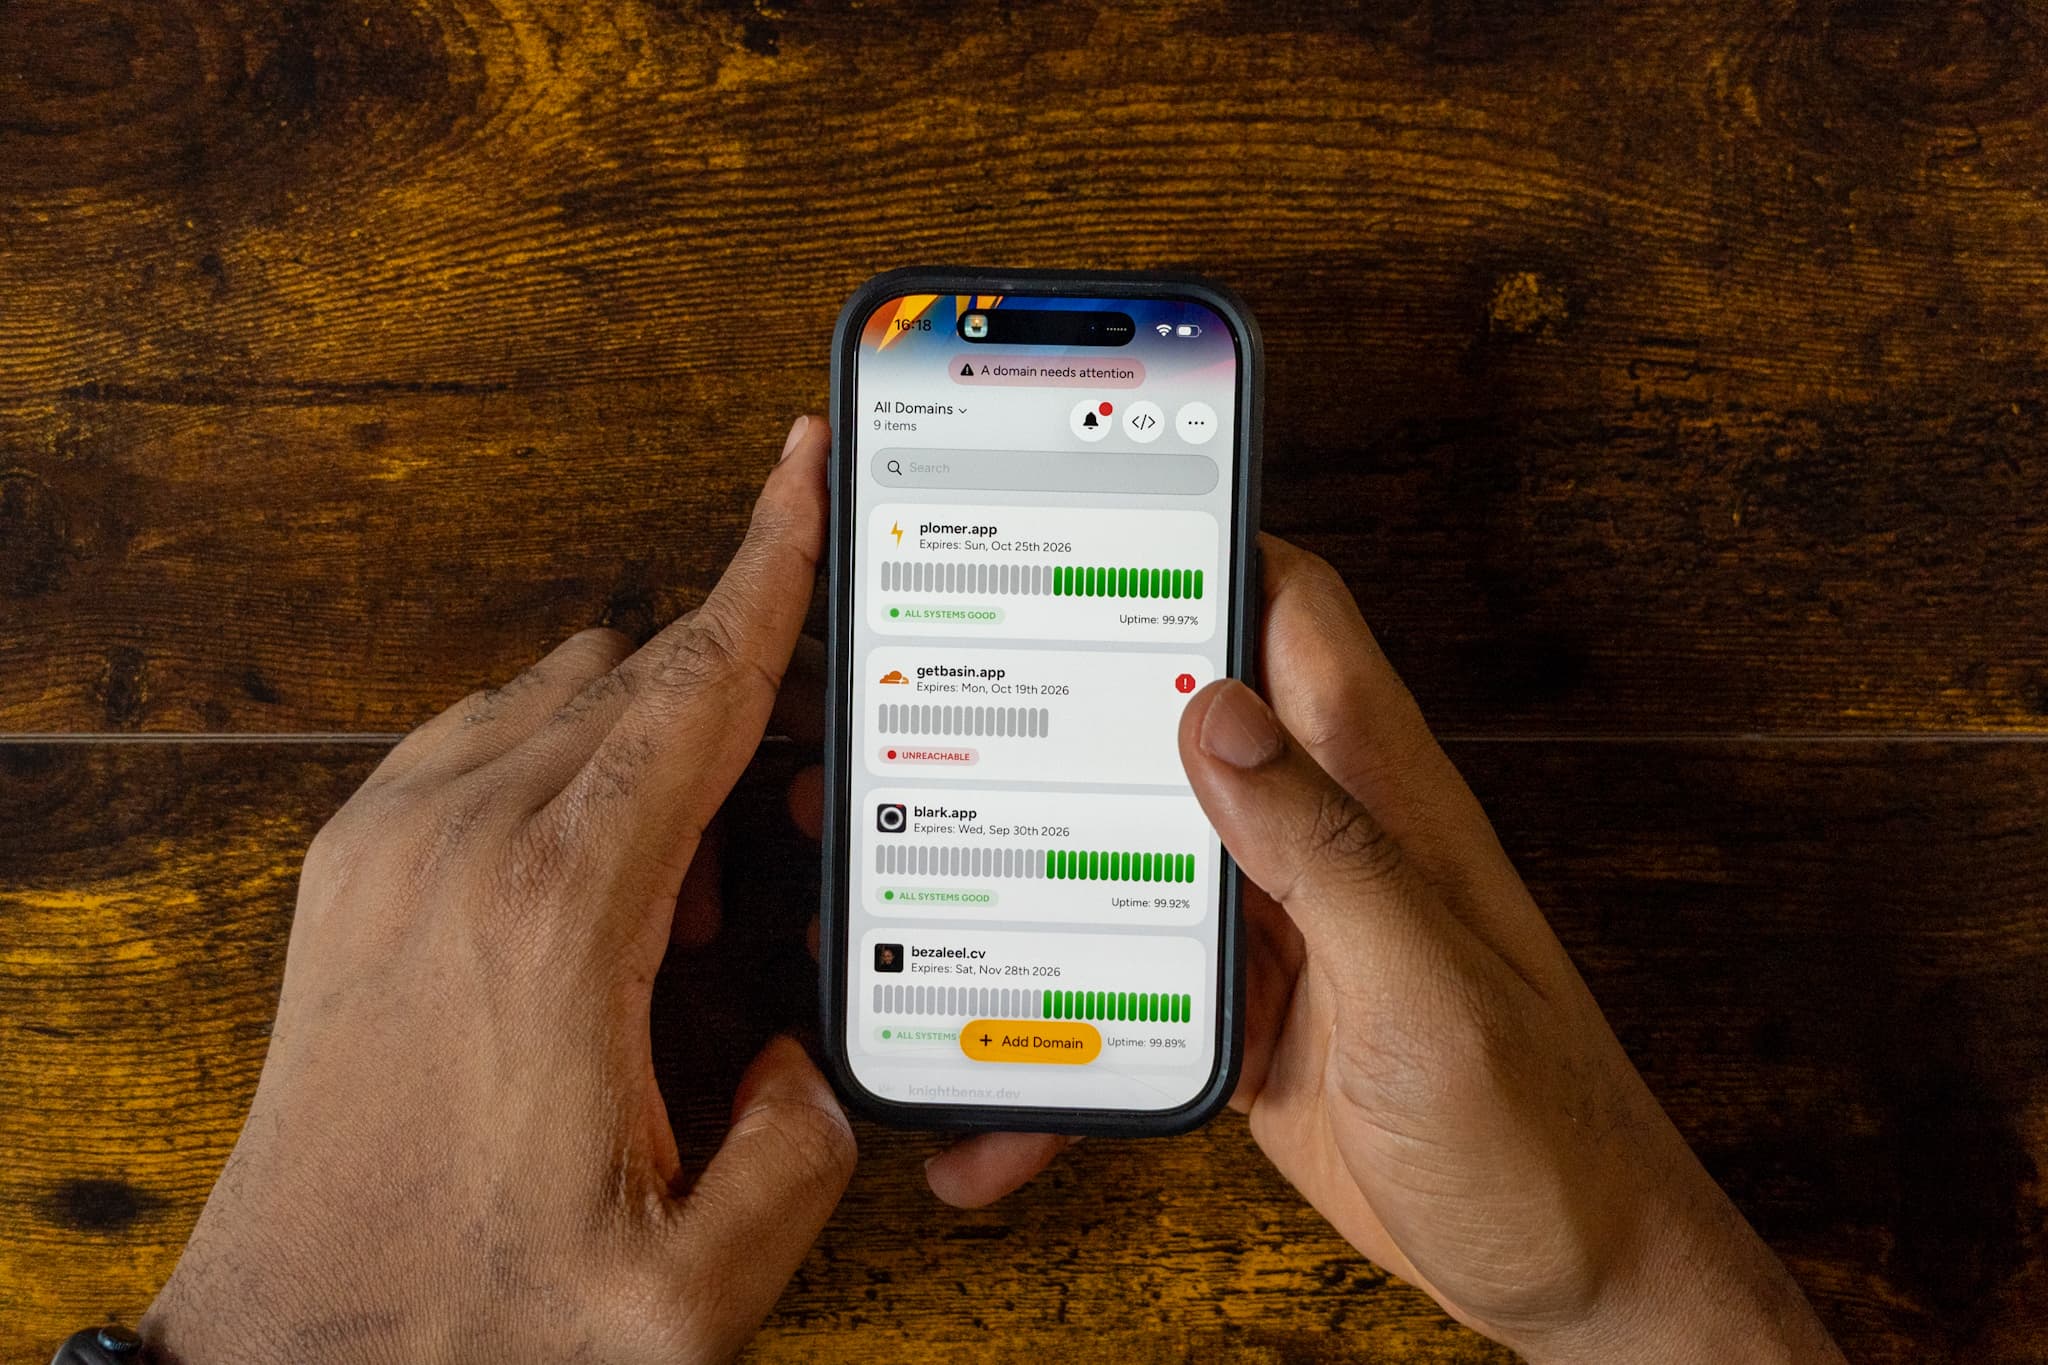
At Plomer, this philosophy is at the center of how we think about observability. Rather than forcing you to jump between dashboards, logs, domain monitors, and webhook viewers, Plomer brings those signals together into a single stream of meaningful events. The goal isn't simply to show you more information—it's to help you understand what's happening across your applications at a glance.
Your Entire Application Has a Pulse
Modern applications are no longer a single server sitting in a data center.
They're ecosystems.
Domains.
DNS providers.
SSL certificates.
Cloud infrastructure.
Payment gateways.
Authentication providers.
Background workers.
External APIs.
AI services.
Webhook consumers.
Every dependency introduces another opportunity for something to change.
The more distributed your architecture becomes, the more important event visibility becomes.
When these signals live in separate tools, it's difficult to see the whole picture.
When they're viewed together, relationships become obvious.
What looked like five unrelated issues often turns out to be one underlying cause.
Confidence Is the Real Outcome
The best monitoring systems don't just reduce downtime.
They increase confidence.
Confidence to deploy on Friday afternoon.
Confidence to release features faster.
Confidence to integrate new services.
Confidence that if something unexpected happens, you'll know about it before your customers do.
That confidence changes how teams build software.
Developers move faster because they aren't flying blind.
Support teams resolve issues more quickly because they have context.
Businesses lose less revenue because problems are discovered sooner.
Customers experience software that feels reliable—not because nothing ever breaks, but because issues are found and resolved before they become widespread.
Listening Is a Competitive Advantage
Every application produces events.
Successful teams don't necessarily produce more events than everyone else.
They simply listen better.
They understand that every deployment, every webhook, every certificate renewal, every DNS update, every background job, and every customer interaction contributes to a larger story.
The teams that stay ahead aren't the ones with the biggest dashboards.
They're the ones that know which signals matter.
That's where thoughtful event monitoring makes the difference.
With Plomer, you can centralize events from your applications, domains, webhooks, monitoring services, and infrastructure into one place, helping your team move from simply collecting events to understanding them. Because when your software can clearly tell you what's happening, you spend less time chasing problems—and more time building what's next.